Filed Under: Technical SEO Resources, Crawling
Summarize this Post using AI
Log File Analysis in SEO is a critical task every Technical SEO should have, as reading your server file logs can uncover potential chances to know why certain pages or group of pages are not crawled, indexed or even blocked from your webserver’ end.
In this article we will explore “Log File Analysis In SEO”, how to read your webserver log file, what to do with these data in the log file and many more useful information on the Log File and it’s impact on Technical SEO and specifically Crawl Budget assigned to your domain.
Before, stepping into our Article if you need help with your Log File Analysis or fed-up to make decisions based on the found data, you can request my Technical SEO Audit Services to help you out on this.
What Is a Webserver Log File Within SEO Context?
Think of Webserver Log File like fingerprint machine in the company your work for, at the morning you put your fingerprint on the machine to “Log” your presence at the company at this specific time and same as when you are leaving you also put your fingerprint on the machine to “Log” your end of workday.
Accordingly, Webserver log file is a simple text file which contains information and data about : Who visited your website, his IP Address, The country, the useragent (UA) this user mimicked his visit and many more data about the visits happened and landed on your website.
Analyzing Log File for SEO opportunities is a thing which you should if not must pay attention for, as It has more accurate data which shows up in Google Analytics and Google Search Console. A Webserver Log File usually looks like this :

Screenshot showing Log File for my Website from my Webserver.
Interpreting the image above into readable data points can be:
- 68.183.200.102: This is the IP which visited my website or Host
- Timestamp: [17/Jan/2026:07:15:02 -0500]
The request occurred on January 17, 2026, at 7:15:02 AM, timezone offset -0500 (EST/Eastern Time). - HTTP Request: “GET / HTTP/1.1”
- Method: GET (retrieving data)
- Resource: / (root/homepage of your website)
- Protocol: HTTP/1.1
- Status Code: 301
- This is a redirect response – the server permanently moved the requested resource to a new location.
- Response Size: 795 bytes
- The size of the server’s response to this request.
- Referrer: “-”
- No referrer information (the client didn’t come from another page via a link).
- User Agent: “Mozilla/5.0 (X11; Linux x86_64) AppleWebKit/537.36 (KHTML,
like Gecko) Chrome/142.0.0.0 Safari/537.36”
- The visitor was using:
- Chrome browser (version 142.0.0.0)
- Linux operating system (x86_64 architecture)
- Desktop device
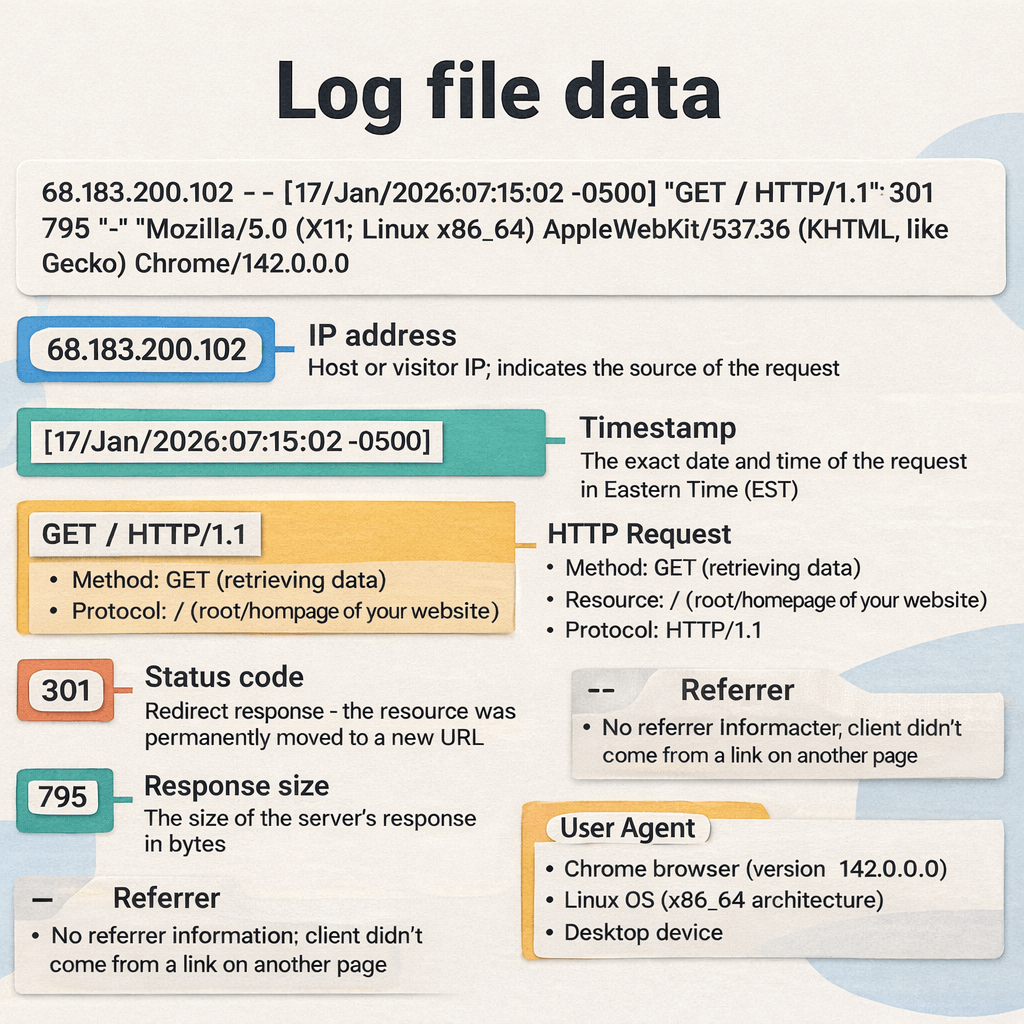
Figure 1: The Anatomy of a Log File Entry. This diagram breaks down a raw server log line into its essential components. For SEO analysis, paying close attention to the Status Code (e.g., the 301 Redirect shown above) and the User Agent is critical for understanding how bots and users interact with your site.
Why Log File Analysis is important for your Technical SEO?
Log File Analysis is important in Technical SEO because it helps you uncover what are nature of visits to your website, which files most are visited and consumed by bots, what popular paths (URLs) on your website gets the most bot hits, what are the identities of the visitors of the website, information about IP addresses and more.
A Basic example and usage for Log File Analysis in SEO, is to help you identify important URLs which gets most of bot hits going to this URLs and accordingly you can readjust your internal links plan and strategy from that point. (Raw data turned into real-world decision).
Here are some of real-world use cases and examples for Log File Analysis in SEO and how it can uncover untapped potential for better Technical SEO Optimizations.
Filtering Good Bots from Bad Bots
One of the importance uses for Log File Analysis is to filter out “Google Bots” From “Bad Bots”, the web ecosystem contains both: Good Scrapers and bad scrapers which stresses your server without tolerance. Using Log File Analysis can easily filter-out Good from Bad Crawlers from accessing your website files.
You can read Imperva Guide on Bot Management at the DNS level and how it operates, as part of the cyber-attacks is DDOS and in practical words DDOS stands for “Distributed Denial Of Service” which floods your webserver with fake visits in order to take your services down and all of these actions mainly executed by Bad bots in the first place.
Bad bots can legitimate themselves as legitimate bots or Crawlers through faking their UserAgent String and that’s why you can verify Google Crawlers and fetchers and Bing Crawlers list.
Crawl Budget Hidden Opportunities
Crawl Budget Optimization can be done solely from within your Log File entries from your webserver, through identifying where the Crawl Waste is going and comparing it against the Crawl Stats in Google Search Console settings for any discrepancies in data readings.
For example, if Crawl Stats reading in your Google Search Console saying that in “By file type” card in Crawl Stats section, saying that 26% of Crawl requests by file type going to CSS assets, this is what Google Search Console says.
Going to Log File and analyzing the entries against these data for accuracy and discrepancies will be important here as you can export your log files or download it in GZ format or if the log files is too large to parse you can use Logpush by Cloudflare for enterprise solutions, where which you can connect your Webserver log file to Cloud Storage Buckets like : S3, GCP and Azure or alternatives and from Log Push you can connect to your Storage Bucket to begin reading and analyzing the Log File data entries.
As it will tells you a good sign to go back to your .htaccess file and adjust its caching rules and so as the CDN (If you are behind one) to make it aligned with the changes you have implemented.
Discovering 4XX and 3XX Errors
Analyzing your Log Files for client-side errors (4XX) and redirection status codes (3XX) returned from URLs on your website you are not aware of. In simple terms, client-side error are errors that happened from client end due to for a famous example, typing an expected character after specific segment in URL can lead to 404 Not found, this is an example of client-side error.
For redirections, 301 redirects status code refers to permanent redirect in-place happened from old URL to new URL and if this redirection is temporary, then the status code will be 302 Temporary redirect. But in order not to get away from our main topic, Log File Analysis can uncover these status codes, URLs that are not found (404) and redirections (301 or 302 or sometime 307) and still crawlable from Googlebot.
Finding such resources is good for optimizing your Crawl Budget. Why? Because they are URLs still get crawled, however they can be eliminated to limit only your internal linking graph to URLs pointing to each other with 200 Status code only (Valid and Working URLS).
As this saves lot of Crawl Budget to be condensed elsewhere in your website to focus on crawling and indexing for important URLs which are intended to rank.
Comparing ‘Crawled – currently not indexed’ with Actual hits for these URLs
In my previous post about ‘Crawled – currently not indexed‘ I have discussed that one of the leading factors for URLs ignorance from being Indexed is lack of internal links. For example, you can export set of URLs from the Crawled – currently not indexed report and comparing any of these URLs against the Log File.
This tactic can uncover discrepancies between Google Systems readings and assessment for your URLs and whether these URLs actually still get bot hits from Googlebot or not. And if the answer was “Yes”, you’ve found matching between the Google pages report data and your Log File Analysis readings, then going back to heavy visited URLs from Googlebot and link back to these URLs (When only relevant).
And if there are no internal resources for these URLs, you can further created related content under the same cluster and link back to this orphaned resource or URL.
Validating ‘Discovered – currently not indexed’ patterns with Log Files
While the previous report deals with URLs Google has actually visited, the ‘Discovered – currently not indexed’ status presents a different challenge: Google knows the URL exists but hasn't allocated the resources to crawl it yet. You can export this specific list from Search Console and run it against your Log File to check for valid attempts.
This comparison usually reveals whether Googlebot is ignoring the queue entirely or if it
attempted to crawl but encountered server-side resistance (like timeouts). If your logs show
zero hits, it confirms the bot is deprioritizing these pages before even entering them.
I have detailed the specific steps to resolve this queue bottleneck in my new article on
Discovered –
currently not indexed. If the logs confirm a lack of hits, you can apply
the same strategy
mentioned above: locate high-traffic pages and add internal links to these "discovered" URLs to
force Googlebot to prioritize a crawl.
Assess Crawl Efficiency after migration
Post-migrations are very critical when it comes to monitoring Googlebot and other Crawlers response to your migration from a host to another and this can be checked in Log File Analysis. Checking whether Search Crawlers are hitting the new domain with visits or not, whether they come from their old corresponding URLs on the old domain or not and so on.
Also, Log File Analysis can be useful when it comes to debugging indexing issues post-migrations, whereas you can also roll-back to old version immediately in case of any severe issues that can occur in place.
Evaluation Your Server Response Time
Analyzing Log Files can uncover the Server Response Time against Crawlers requests, which means you can compare the average response time which can be found in Crawl Status in Google Search Console, against the actual response time in Log File for any discrepancies in the data readings.
Server Response Time from Log File Can be analyzed through ‘When was your webserver received the hit from the bot” vs “What status code and when your webserver responded with”. From this point, you can know the health of your webserver, in order to further adjust the caching policies lifetimes for your web assets which deserve long cache policy, also I discussed this part in my Crawl Budget article.
After we have discussed the importance of Log File Analysis for Technical SEO. Let’s move onto our next section of the article, which will discuss how to download your Log Files and Prepare it for analysis.
How to download Log Files and Prepare the data for analysis?
In order to begin your journey with Log File Analysis for SEO with data, first and foremost, we need to download the raw logs from our webserver.
Log Files Downloading Process
The process of spotting and download the raw Log Files from the webserver is simple but depends on your hosting infrastructure. For Example:
- Self-Hosted Environments (Apache/NGINX): If you are managing your own VPS
or dedicated server, you typically have the most freedom here. You can usually access the
raw access logs directly via the command line. For Apache, you’ll generally
find them at
/var/log/apache2/access.log, and for NGINX, they usually reside in/var/log/nginx/access.log. - Managed WordPress Hosting: On platforms like WP Engine or Kinsta, direct server access is often restricted for security. However, you can typically grab the logs through their specific user dashboards or via SFTP. If the path isn’t immediately clear in your file manager, a quick ticket to their support team will usually get you the raw request logs you need.
- Shared Hosting Providers: If you are on a shared plan (like Bluehost or GoDaddy), obtaining granular data can be hit-or-miss. While most offer a “Raw Access Logs” icon within cPanel, be aware that these providers often rotate logs frequently to save space. You might only get the last 24 hours of data unless you’ve configured archiving beforehand.
- Cloud Infrastructure (AWS, GCP, Azure): For enterprise-level setups, logs aren’t usually sitting in a simple text file on a disk. Instead, traffic data is routed to centralized management tools like AWS CloudWatch or Google Stackdriver. You will need to configure specific export policies to pull this data out into a readable format for our analysis.
Cleaning and Pre-processing Your Log Data
Cleaning your log files isn’t just about tidiness; it is about data integrity. A raw log file is essentially a “firehose” of information, and trying to analyze it without filtration is the fastest way to reach the wrong conclusions about your Crawl Budget.
Before we can extract actionable insights, we need to reduce the noise to signal ratio. In my workflows, this pre-processing phase focuses on:
- Isolating Verified Crawlers: As we discussed in the “Good Bots vs. Bad Bots” section, we must filter the dataset to strictly include verified User Agents (like Googlebot Smartphone or Bingbot). Analyzing spoofed requests will skew your data on crawl frequency.
- Filtering “Non-SEO” Assets: While analyzing the crawl budget on resources (CSS/JS) is valid, when you are diagnosing indexability or ranking issues, you should filter your view to focus on primary content (HTML pages and PDFs), removing the clutter of images, fonts, and scripts.
- Standardizing Timezones: Server logs often record in UTC or the server’s
local time (like the
-0500offset seen in my log screenshot earlier). You must normalize these timestamps to a single format to accurately correlate crawl spikes with your specific deployment times or Google Core Updates. - Data Injection: Once cleaned, this data needs to be moved into a visualization tool (like Looker Studio or a Python framework) where we can actually segment the data by directory or status code type.
Constraints & Blind Spots to Watch Out For
Even with a pristine dataset, Log File Analysis has inherent limitations. As a Technical SEO, you need to be aware of the “blind spots” that can affect the accuracy of your audit:
- Syntax Inconsistencies: Not all logs are created equal. Apache and NGINX (and certainly IIS) structure their output differently. If you are parsing logs programmatically (e.g., using Python or Regex), ensure your parser is calibrated to the specific server syntax, or you will end up with misaligned columns.
- The “Data Vanishing” Act: Many hosting providers—especially shared ones—have aggressive retention policies. They might only keep raw logs for 24 to 72 hours. If you aren’t running an automated script to archive these daily, you will lose historical data, making it impossible to diagnose past traffic drops.
- Privacy & PII Compliance: Log files contain IP addresses, which are considered Personally Identifiable Information (PII) under regulations like GDPR. If you are storing these logs long-term or processing them for a client, you should hash or anonymize client IPs to remain compliant.
- The “Spreadsheet Ceiling”: Manual analysis works for small blogs, but it is a trap for enterprise sites. Excel and Google Sheets will choke on datasets exceeding 1 million rows. For large-scale Log Analysis, you must move toward database solutions (like BigQuery) or dedicated log analysis tools to handle the volume efficiently.
How to build real-world and Technical SEO decisions based on Log File Analysis?
The main objective from Log File Analysis not to find geeky lines of codes and dive-in, rather to find serious technical SEO issue which acts as silent killers for your organic growth and accordingly revenue from organic search and LLM Visibility too.
Accordingly, the role of this Log File Analysis is to build actionable deliverables by prioritizing the the output and effort for each fixation, which in return will impact on better: crawlability, indexation and accordingly more visibility in organic search.
Here are real decisions that can be made and executed on based on Log File Analysis readings.
Internal Linking Optimization
One of the most valuable insights you can extract from log files is the discrepancy between your Site Architecture (how you linked your pages) and Bot Behavior (how Google actually traverses them).
In many of my Technical SEO audits, I find high-value “money pages” buried deep in the structure, receiving zero hits from Googlebot. On the flip side, I often see low-value archive pages consuming a massive chunk of the crawl budget.
- Identifying “Orphan” Winners: Cross-reference your log data with a fresh crawl (using Screaming Frog or a custom Python script). If a page exists in your database but shows zero log hits, it is effectively invisible to search engines. You need to reintegrate these pages by linking to them from high-authority nodes like your Homepage or popular category headers.
- Pruning the “Zombie” Pages: Conversely, if logs show bots are obsessively
crawling pages that generate no traffic or conversions (like old tag pages or empty
categories), you are wasting resources. Use this data to justify a content pruning
strategy—either
noindex, 301 redirect, or delete these resource-hogs to consolidate signals to your winners.
Large Language Models Behavior Tracking
We are currently in the “Wild West” of AI Search. While many SEOs are panicking about SGE (Search Generative Experience), smart Technical SEOs are looking at the logs to see who is actually training on their data.
Server logs are the only source of truth here. Tools claim to track this, but logs don’t lie. You
need to grep your logs for User Agents like GPTBot, ClaudeBot, or
Amazonbot.
- To Block or Not to Block? If you see heavy activity from these bots, you
have a decision to make. If you want brand visibility in ChatGPT answers, you might allow
GPTBot. If you are a publisher protecting your IP from being scraped for free, you can block them viarobots.txtor strictly control them using Cloudflare WAF rules. - The “Honeytrap” Experiment: You can even set up specific segments of your
site to test AI bot appetite. If
GPTBotis hitting your long-form guides but ignoring your product pages, that gives you insight into what kind of data they value most from your domain.
Checking on shop filters against Crawl Patterns to eliminate Index Bloat
For large ecommerce sites or programmatic projects (like the laptop comparison sites I work on), Faceted Navigation is the silent killer of Crawl Budget.
If your logs show Googlebot spending 40% of its time crawling URLs like
?color=blue&size=small&price=desc, you have a classic Index
Bloat problem. Bots are getting trapped in infinite combinations of filters that
provide no unique value to the index.
- The Fix: Compare the log hits on these parameterized URLs against their organic traffic. If they are being crawled thousands of times but driving zero clicks, you need to tighten your directives.
- Actionable Steps: Implement
noindextags on non-essential filter combinations, or userobots.txtto disallow specific parameters (e.g.,Disallow: /*?price=). This forces Googlebot to focus its attention on your canonical Product and Category pages.
Spotting and elimination of Crawl Traps or Crawling Loops
A “Crawl Trap” is essentially a black hole for bots. These are infinite path structures that can keep a crawler stuck in a loop until it abandons your site entirely.
I often see this in:
- Infinite Calendars: Next/Previous links that go on for years (e.g.,
/events/2030/). - Broken Relative Links: URLs that stack incorrectly (e.g.,
/blog/category/blog/category/foo). - Redirect Loops: A chain of 301s that points back to itself.
If your log analysis reveals a single bot hitting the same pattern of URLs thousands of times in
a
short session, you’ve likely found a trap. Breaking these cycles—usually by fixing the link
logic
or adding Disallow rules—is one of the fastest ways to recover wasted Crawl Budget.
Readjusting robots.txt file and Canonical Tags based on Crawl Patterns
There is often a massive disconnect between what you tell Google to do and what it
actually does. Log analysis is the reality check for your robots.txt and
Canonical strategy.
- Canonical Ignorance: You might have a
rel="canonical"tag pointing from Page A to Page B, but if your logs show Googlebot is still aggressively crawling Page A, your signal is too weak. You may need to switch to a stronger signal, like a 301 redirect. - Robots.txt Leakage: Sometimes you think you’ve blocked a directory, but a
typo in your regex allows bots through. If you see status code
200hits on URLs that are supposed to beDisallowed, yourrobots.txtis failing. Use the log data to refine your rules and then monitor the logs post-update to confirm the hits drop to zero.
Monitoring the hydration of modern Heavy-JS Webapps
If you are working with modern frameworks like React, Next.js, or Vue, you know that “Crawlability” isn’t just about reaching a URL—it’s about rendering.
One of the trickiest issues I diagnose in JavaScript SEO is partial rendering, where Googlebot hits the page but fails to wait for the “hydration” process (where the static HTML shell gets populated with dynamic data). Log files are the only way to confirm this behavior without guessing.
- The “Empty Shell” Check: You can validate rendering by looking at the
sequence of requests. If you see Googlebot requesting your core HTML document (
200
                                OK
) but you do not see subsequent requests for the critical.jsbundles or API endpoints (e.g.,/api/v1/products) that actually contain the content, Google is likely indexing an empty or loading state. - SSR vs. CSR Verification: For sites using Client-Side Rendering (CSR), this gap is common. If your logs confirm that bots are skipping the resources needed for hydration, it is a strong signal to push your development team toward Server-Side Rendering (SSR) or implementing Dynamic Rendering to serve a pre-rendered HTML snapshot to bots.